
Worp Isn’t Predictive, Or Is It?
Prep: WoRP as A Predictive Model
We all know WoRP gives you past results, but if you just used WoRP as your rankings, how well would it work? Can WoRP predict the outcomes of individual players?Well good thing for you, I went through and collected the data, and found out whether using WoRP to rank players for the season makes sense (or not). A small teaser: There is a scenario where it does make sense, or I wouldn’t be writing this article, would I?HOw Accurate are WoRP PRedictions?
Sorry if you don’t like math, but we are going to need to learn a few things here. If it gets hard, I promise that if you make it to the end, it will make sense. You can always come back a re-read to clarify things later.In statistics, you can measure the correlation between two datasets using a value called R-Squared. It doesn’t matter what its called, or where it comes from, but what does matter is that a value of 0 means there is no correlation between the datasets, and a value of 1 means that the datasets perfectly describe each other. To compare the accuracy of two predictive models, you can compare the R-Squared values and see which one is higher. Let’s do an example.Let’s see how good of a predictor WoRP from 2021 is for 2022. I’m going to use WoRP/G So I don’t need to worry about the number of games someone played. Now, we need something to compare it to. Let’s compare it To each week of the 2022 season, and chart it. Because let’s be honest, without a chart, you weren’t reading all this anyway. Let’s put 2022 WoRP in Dark Blue, and 2021 WoRP in Light Green.
Ooh, so exciting I know. But what does this mean? If we are trying to predict the end of season WoRP/G value of an Individual player, by week 2 we already have enough data that using just those 2 weeks is better than using the entire previous season! Now that’s some predictive power!BUt Wait, that’s Not Entirely Predicting
That’s right, we forgot about something really really important. If we are using Week 1 and Week 2 data to predict how players finish on the season long WoRP results, part of our prediction data is in our result! As we get further and further into the season, our "predictions" are more accurate, because we are just regurgitating the same data more than we are predicting the rest of the season. That doesn’t help us as fantasy players. I don’t want to know that Kirk Cousins will be QB 1 Across the whole season, I want to know if he will be QB 1 the rest of the season! Instead of making our prediction on the end of season results, lets only do it for the rest of the season. Lets make another graph, but only predicting future weeks instead of past weeks. And lets compare to the Previous year’s WoRP Data.Once Again, Let’s put 2022 WoRP in Dark Blue and 2021 WoRP in Light Green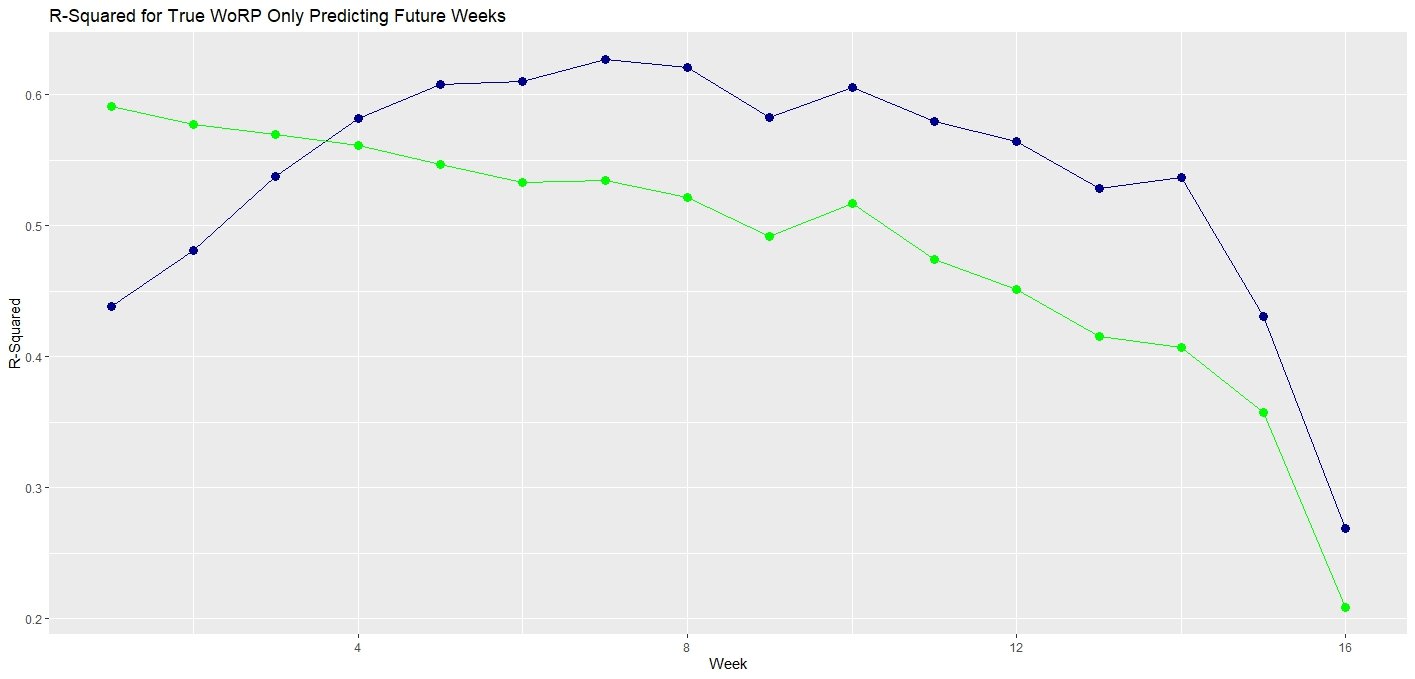
You know, that’s exactly what we expected. At the beginning of the season, WoRP predictive accuracy is poor, but it steadily increases as the season goes on, until about week 5, where it levels off, and then as we get closer to the end of the season, and trying to use Weeks 1-16 to predict Week 17, our predictions fall off and become worse!Of course that regression happens, there are fewer games, and fantasy football has extremely high variance week to week. No matter how good your model is, trying to predict one week of the season is going to go poorly. That’s why we use WoRP to look at the value across the whole season, and not just one week.But what about the previous year? After week 4 using the previous year’s WoRP data to predict the future year was worse, so once again, we have shown it only takes a few weeks before this year’s WoRP is better than last year’s!Was 2022 an outlier?
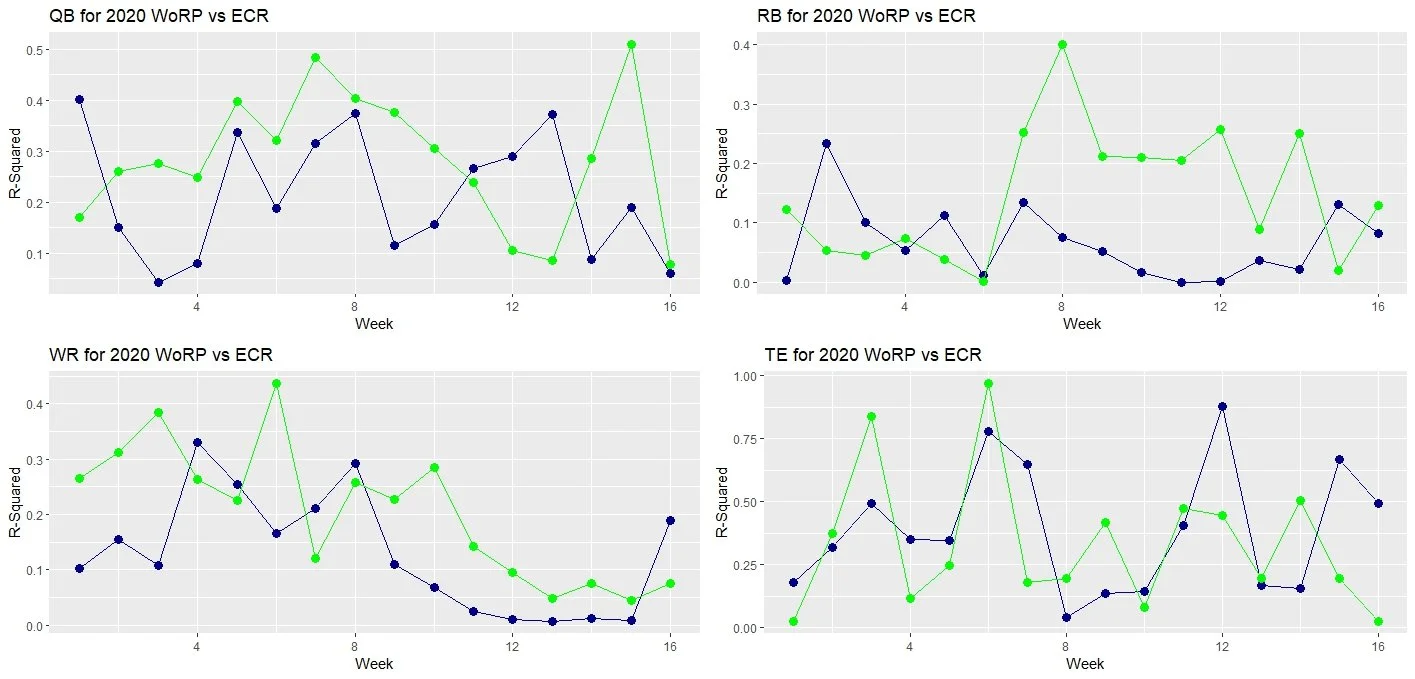
This is easy to answer: No! In fact both 2020 and 2021 have similar charts to 2022. The only difference is that in 2020, In week 2, that year’s WoRP was a better predictor than using 2019s. I’ll chalk that one up to the covid season throwing a wrench in everything.Now We are Cooking: WoRP vs ECR
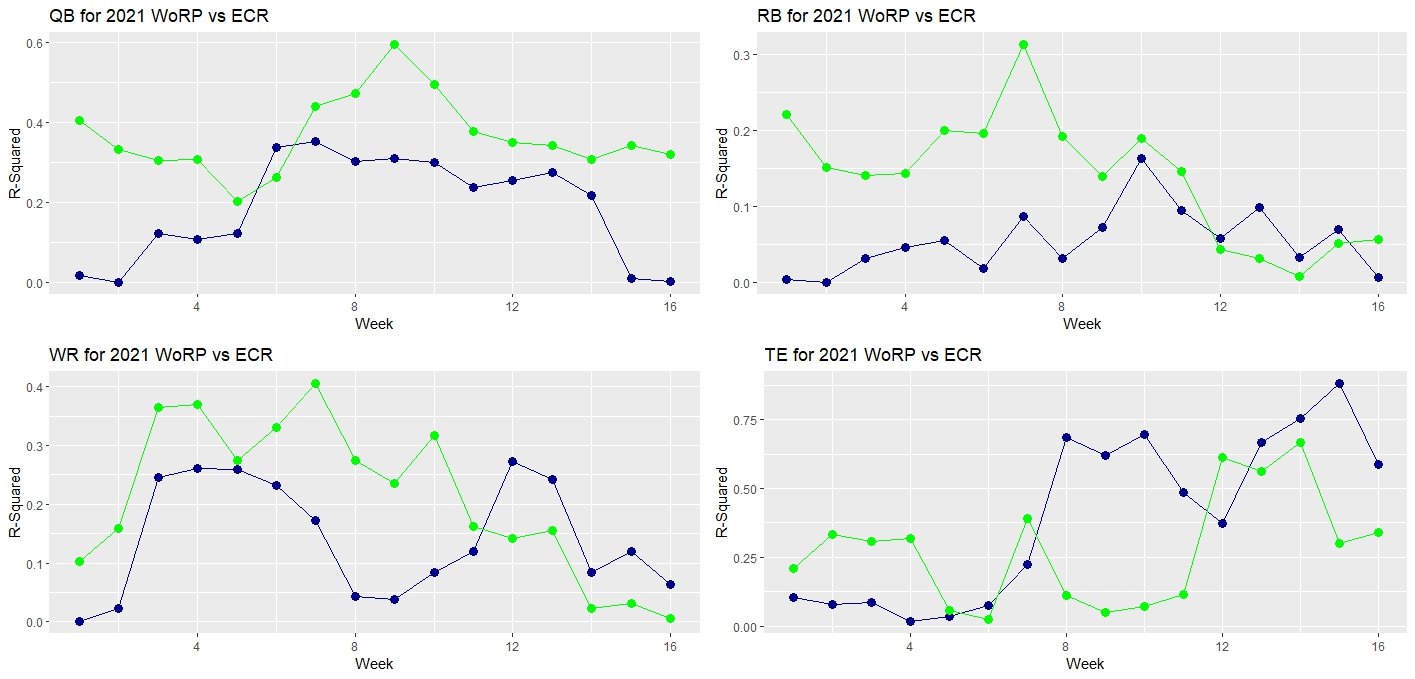
Now that we know how to compare the predictive power of WoRP to itself, lets compare to something better. Let’s do it against the FantasyPros Rest of Season Expert Consensus Rankings for each week. Why those? Because it gives a week by week updated ranking, and I can find that data. (Big shout-out to the NFLVERSE and FFVERSE Ecosystem for having this data saved!)Before we start charting though, we have 2 problems. FantasyPros only gives positional ranks, not WoRP value predictions, so we need to use the ranks from the WoRP tool, rather than the actual value results. That is fine, but is going to change our numbers a bit.Our previous charts covered all positions, and the FantasyPros ROS ECR Data is only by position. So we are going to have to make multiple charts, one for each position. Sorry about the graph spam, but I promise, this will be the last, and most important group of data.
Methodology note: We are going to only use players who are ranked in the top 24 QBs, 40 RBs, 50 WRs, and 12 TEs. Outside of those ranges, the WoRP vs ranked values vary so drastically it makes the numbers unusable. And that number of players covers most of the starters you care about anyway.One last time, we will graph the WoRP Ranking Model in Dark Blue, and the FP ECR Model in Light Green.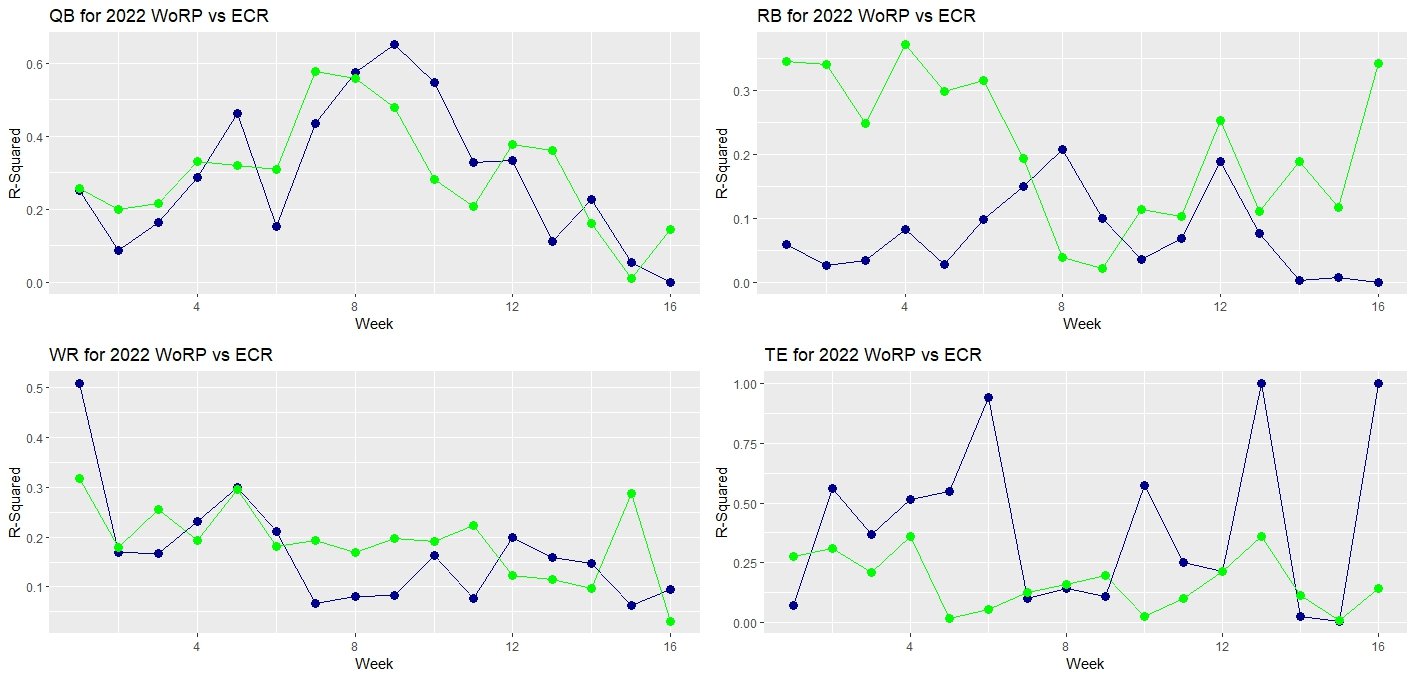
That’s a lot of charts, and I’m sure you looked and studied them all very closely. Just kidding, I’m just going to tell you what I see now because you probably stopped looking after the second one and hoped I would tell you the answers. Let's break it down by position.QUarterback
There were points during 2022 and 2020 where WoRP out-predicted the Experts. That’s awesome! But why did WoRP not outpredict in 2021, and can we predict accurately in 2023? Let’s used what we learned in the first part; WoRP is best at predicting from week 4-Week 14. That fits with the times the WoRP models were predicting better than the experts, Weeks 8-11 in 2022 and 11-13 in 2020. Both of these timeframes are right on that critical time right before trade deadlines, so we want to pay attention to get an advantage there.How will we know whether this is happening in 2023? In both 2022 and 2020, there were clear tier breaks at the quarterback position, Top 4 in 2022, Top 12 in 2020. In 2021, there wasn’t anything close to either of those two years. If we look at the week-by-week WoRP charts from each of those years, the tier breaks began to appear around those times, week 8 in 2022 and week 11 in 2020. However, it didn't take long for the experts to catch on to the trend and start beating the WoRP models again.If we start to see a split in 2023, then I would start looking to WoRP to Rank my QBs instead of the experts. The experts will catch up shortly, so you only have a few week window to take advantage of this information and get one over on your leaguemates.Running Back and Wide Receiver
I’m grouping these together, because I’m analyzing that WoRP is not a good predictor for either of these positions. Just look at the actual R-Squared values compared to the quarterbacks. Values are consistently in 0.1-0.2 range, which is a really really bad correlation. Even the experts aren’t faring that well. Any time the WoRP is better than the experts, I’m attributing to dumb luck rather than an actual consistent pattern.Tight Ends
Lets start with that tight ends are not well represented by WoRP, or by the experts. Just look at the spikes up and down across 2020 and 2022. In 2021, WoRP and the experts go from being a horrendous predictor to an amazing one halfway through the season. Why might that be? Because of the methodology of using only top 12 tight ends, both in the prediction model and the valid results. In reality, there weren’t that many tight ends that hit both these thresholds, and the total number of valid players bounced all over the place week by week, hence why you see huge spikes in predictability.This just shows another win for #TESDONTMATTER, my new phrase for how to value tight ends in lineup leagues. Outside of your top tier tight ends, anyone else can be top 12, and there isn’t a good predictor for who will actually get there. Don’t keep value in the tight end position, and get the cheapest guy with a decent snap share, routes run, or targets, and just let it roll from there. You might score some 0s, but at least you had a guy worth nothing scoring a 0 and not a guy worth a 2nd.Eating it All Up: What can we take away?
What have we learned? Until we find different ways of interpreting WoRP data, WoRP isn’t great at predicting outcomes for individual players over experts who can insert all the context around different situations, teams, etc. With one exception.If we begin to see a clear tier break at the quarterback position, we can count on WoRP to tell us that those quarterbacks are going to be difference makers at their position, before the experts catch on to the trend. It’s not much, but it is something.So if you have been using WoRP to project individual players, you better stop now. If you want to predict with it, paste your rankings over the results and go from there. Its better than just blindly following the names in the tool. Only use WoRP for Relative positional value. The player names in the tool are to make it easier for you to match tiers of value vs tiers of production. Don’t use them as a roadmap for the future.Thanks for reading,Koopa@dynastykoopa on Xkoopatroopa8 on Discord